# aktiviere das Tidyverse
library(tidyverse)

# Importiere Johns Hopkins Github data
confirmedraw <- read.csv( "https://raw.githubusercontent.com/CSSEGISandData/COVID-19/master/csse_covid_19_data/csse_covid_19_time_series/time_series_covid19_confirmed_global.csv")
deathsraw <- read.csv( "https://raw.githubusercontent.com/CSSEGISandData/COVID-19/master/csse_covid_19_data/csse_covid_19_time_series/time_series_covid19_deaths_global.csv")
recoveredraw <- read.csv( "https://raw.githubusercontent.com/CSSEGISandData/COVID-19/master/csse_covid_19_data/csse_covid_19_time_series/time_series_covid19_recovered_global.csv")43 COVID19 Fallzahlen analysieren
Ich möchte die COVID19-Fallahlen analysieren.
Hierfür gibt es eine schöne Anleitung von der Universität Toronto: https://mdl.library.utoronto.ca/technology/tutorials/covid-19-data-r
Zunächst holen wir uns die aktuellen Daten.
Dann bringen wir sie ins richtige Format.
confirmed <- confirmedraw %>%
  gather(key="date", value="confirmed", -c(Country.Region, Province.State, Lat, Long)) %>%    group_by(Country.Region, date) %>%
  summarize(confirmed=sum(confirmed))
deaths <- deathsraw %>%
  gather(key="date", value="deaths", -c(Country.Region, Province.State, Lat, Long)) %>%
  group_by(Country.Region, date) %>%
  summarize(deaths=sum(deaths))
recovered <- recoveredraw %>%
  gather(key="date", value="recovered", -c(Country.Region, Province.State, Lat, Long)) %>%
  group_by(Country.Region, date) %>%
  summarize(recovered=sum(recovered))
summary(confirmed)
## Country.Region date confirmed
## Length:229743 Length:229743 Min. : 0
## Class :character Class :character 1st Qu.: 3831
## Mode :character Mode :character Median : 52933
## Mean : 1379412
## 3rd Qu.: 499592
## Max. :103802702Jetzt kombinieren wir alles in ein Datenframe und korrigieren die Datumsangaben.
# Final data: combine all three
country <- full_join(confirmed, deaths) %>%
  full_join(recovered)
# Date variable
# repariere Datumsangaben von character nach date
country$date <- country$date %>%
sub("X", "", .) %>%
as.Date("%m.%d.%y")
# Neue variable: Anzahl der Tage
country <- country %>%
group_by(Country.Region) %>%
mutate(cumconfirmed=cumsum(confirmed), days = date - first(date) + 1)Jetzt aggregieren wir auf Weltperspektive und Deutschland.
world <- country %>%
  group_by(date) %>%
  summarize(confirmed=sum(confirmed), cumconfirmed=sum(cumconfirmed), deaths=sum(deaths), recovered=sum(recovered)) %>%
  mutate(days = date - first(date) + 1)
# Extract specific country: Germany
germany <- country %>% dplyr::filter(Country.Region=="Germany")
So vorbereitet können wir Statistiken ausgeben …
# SUMMARY STATISTICS
summary(country)
by(country$confirmed, country$Country.Region, summary)
by(country$cumconfirmed, country$Country.Region, summary)
by(country$deaths, country$Country.Region, summary)
by(country$recovered, country$Country.Region, summary)
summary(world)
summary(germany)
… und Grafiken plotten.
# World confirmed
ggplot(world, aes(x=date, y=confirmed)) + geom_bar(stat="identity", width=0.1) +
  theme_classic() +
  labs(title = "Covid-19 Global Confirmed Cases", x= "Date", y= "Daily confirmed cases") +
  theme(plot.title = element_text(hjust = 0.5))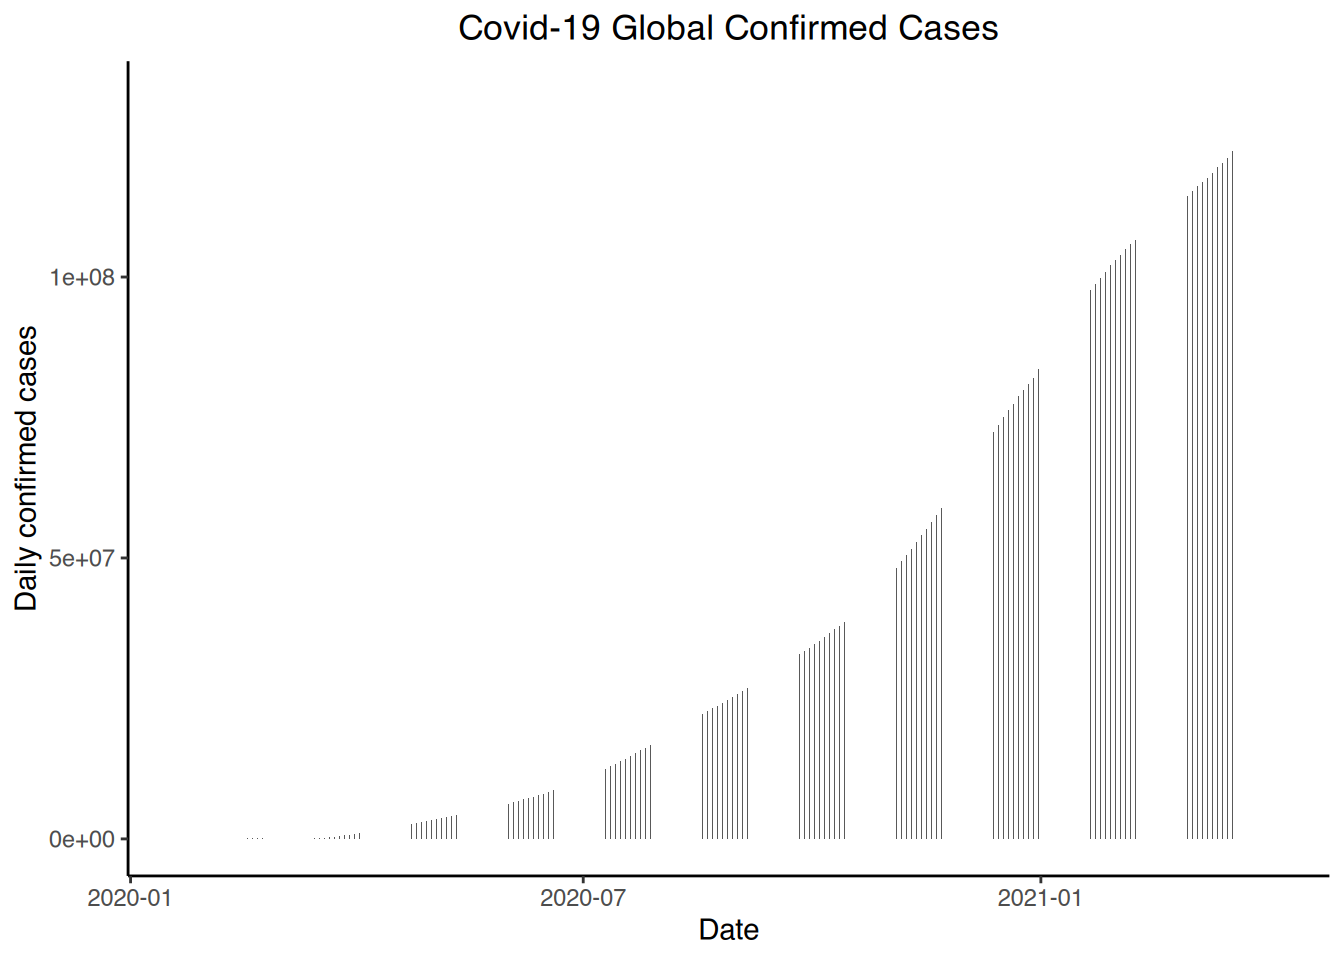
# Germany confirmed
ggplot(germany, aes(x=date, y=confirmed)) + geom_bar(stat="identity", width=0.1) +
  labs(title = "Covid-19 Confirmed Cases in Germany", x= "Date", y= "Daily confirmed cases") +
  theme(plot.title = element_text(hjust = 0.5))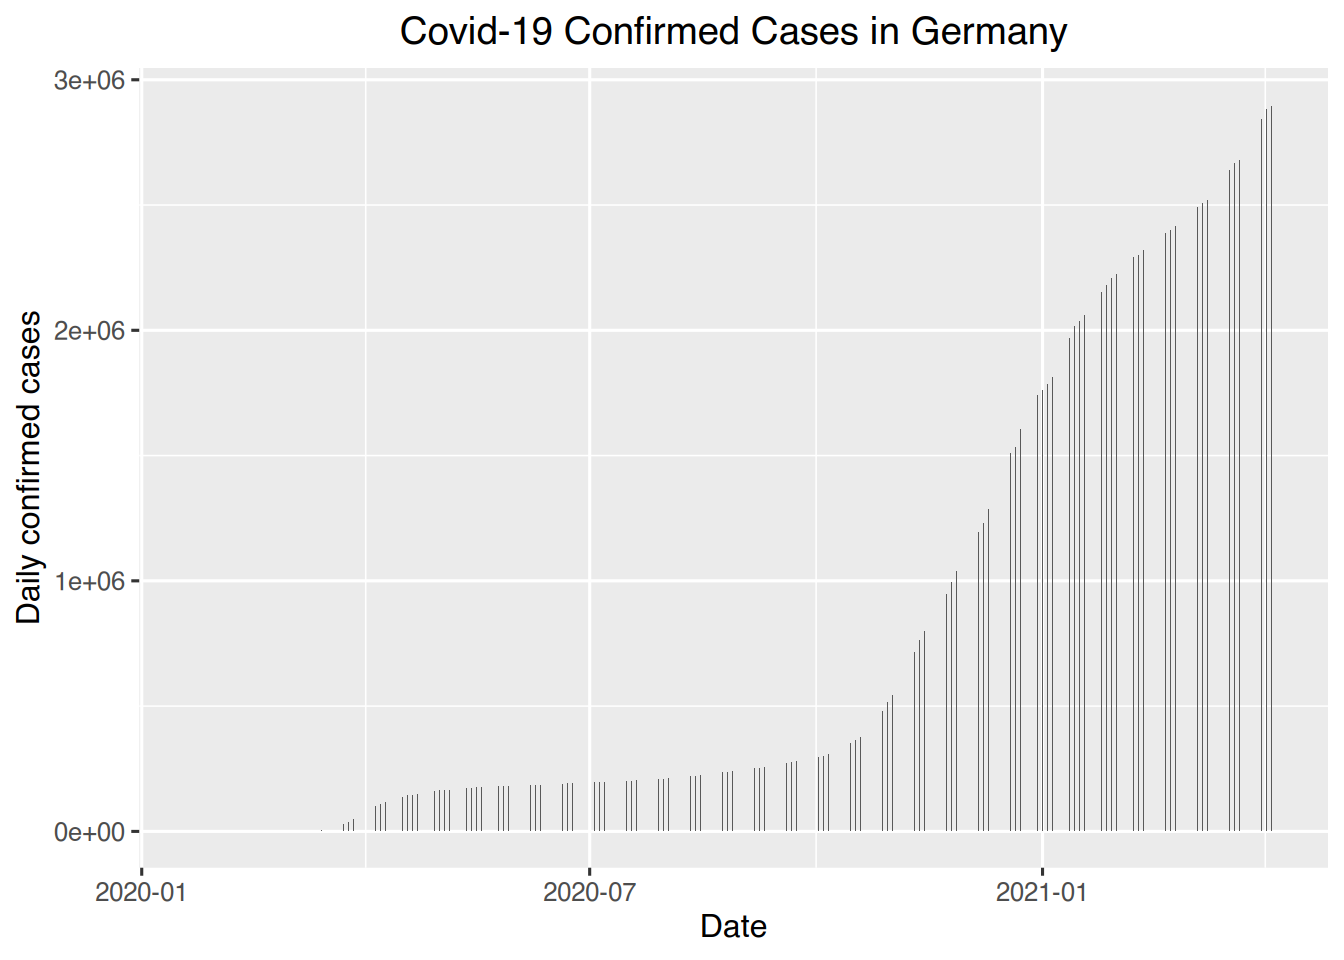
# Line graph of cases over time
# World confirmed
ggplot(world, aes(x=days, y=confirmed)) + geom_line() +
  labs(title = "Covid-19 Global Confirmed Cases", x= "Days", y= "Daily confirmed cases") +
  theme(plot.title = element_text(hjust = 0.5))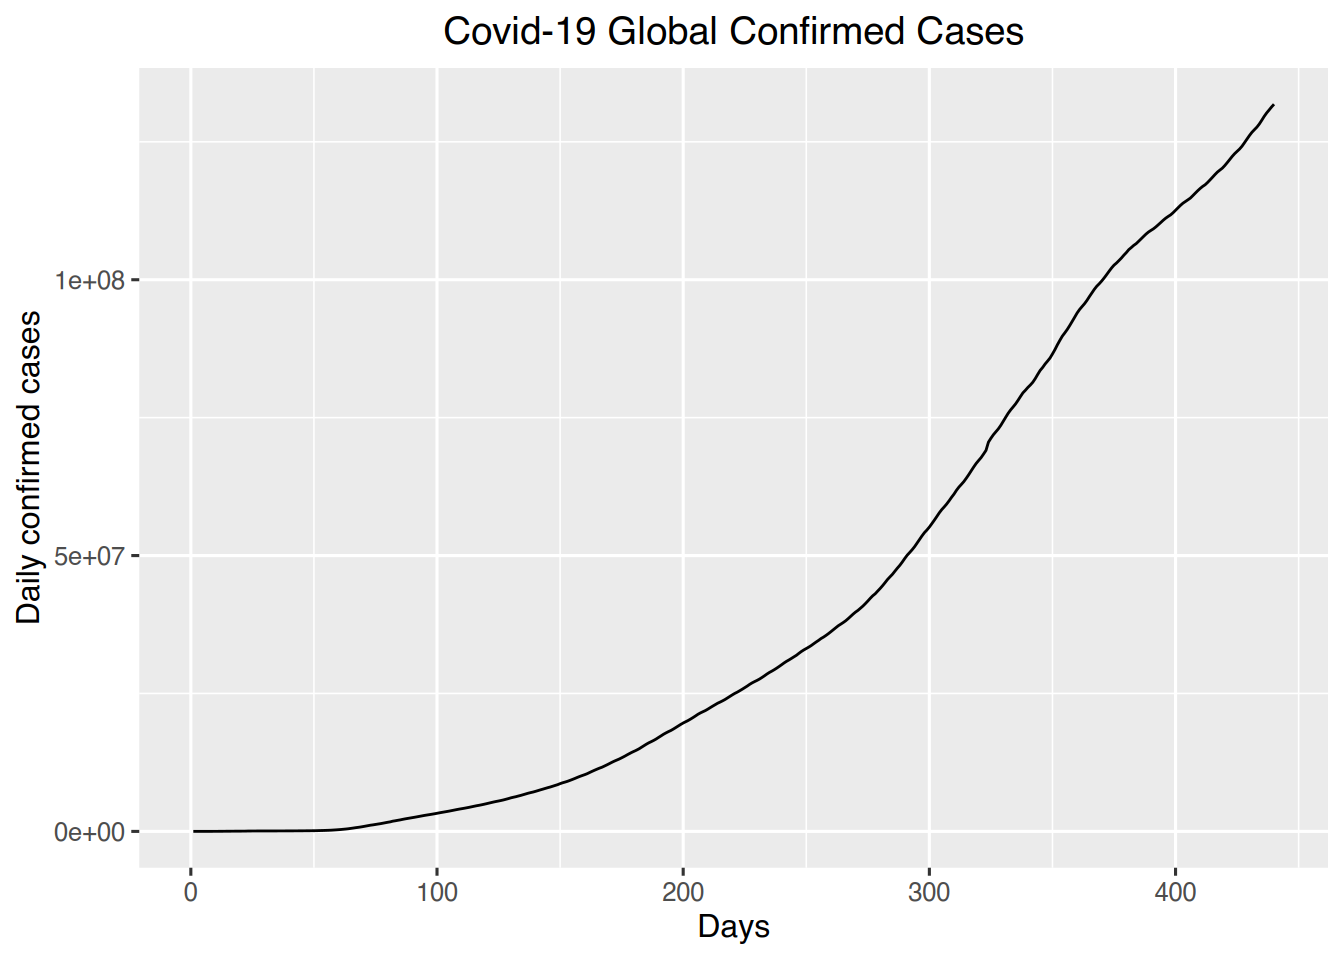
# Ignore warning# World confirmed with counts in log10 scale
ggplot(world, aes(x=days, y=confirmed)) + geom_line() +
labs(title = "Covid-19 Global Confirmed Cases", x= "Days", y= "Daily confirmed cases (log scale)") +
theme(plot.title = element_text(hjust = 0.5)) +
scale_y_continuous(trans="log10")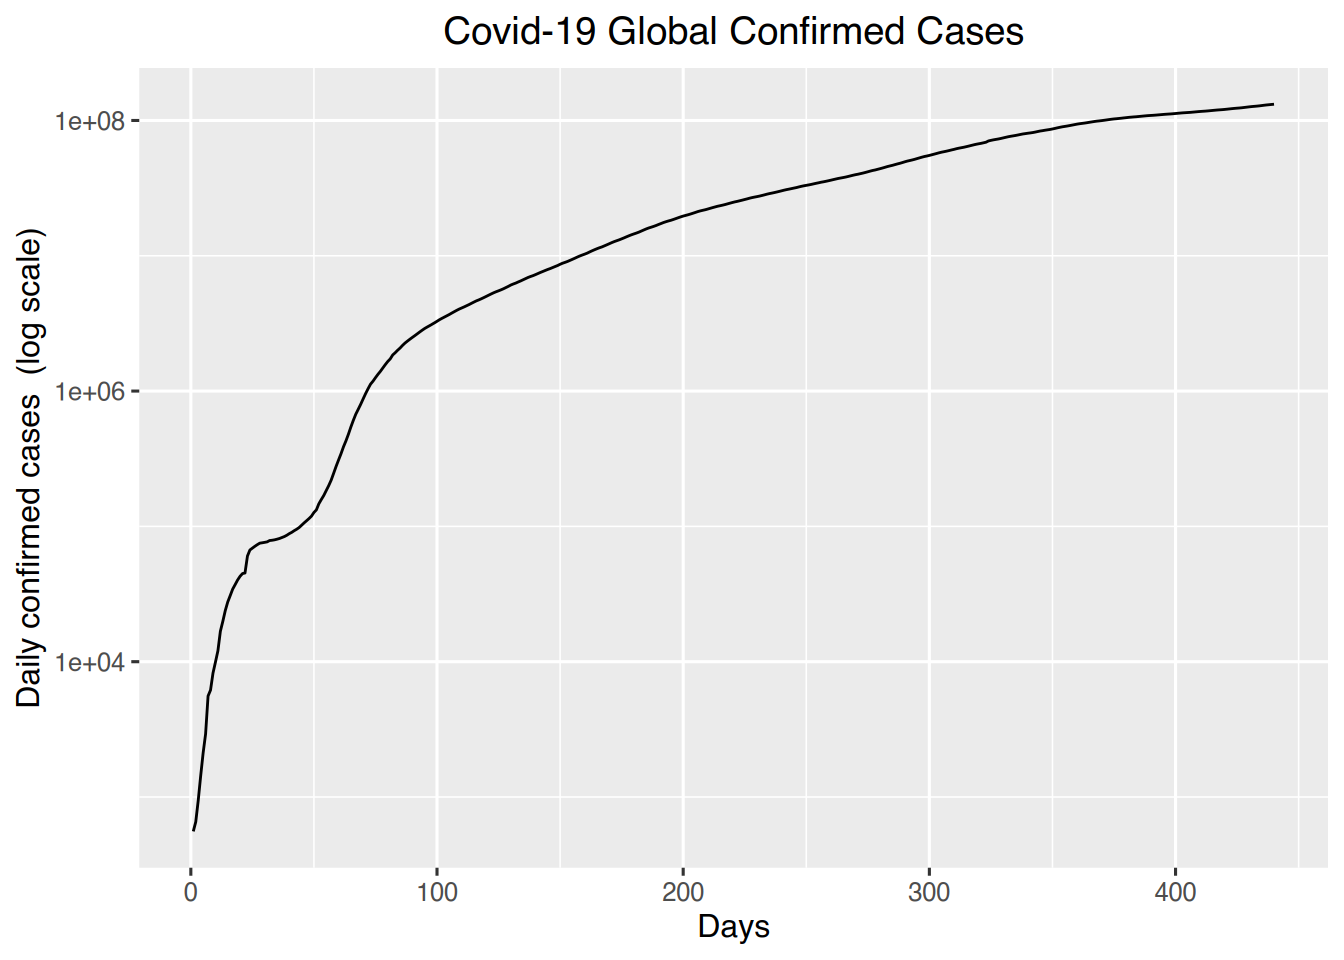
# Confirmed by country for select countries with counts in log10 scale
countryselection <- country %>% filter(Country.Region==c("US", "Italy", "China", "France", "United Kingdom", "Germany"))
ggplot(countryselection, aes(x=days, y=confirmed, colour=Country.Region)) + geom_line(size=1) +
  labs(title = "Covid-19 Confirmed Cases by Country", x= "Days", y= "Daily confirmed cases (log scale)") +
  theme(plot.title = element_text(hjust = 0.5)) +
  scale_y_continuous(trans="log10")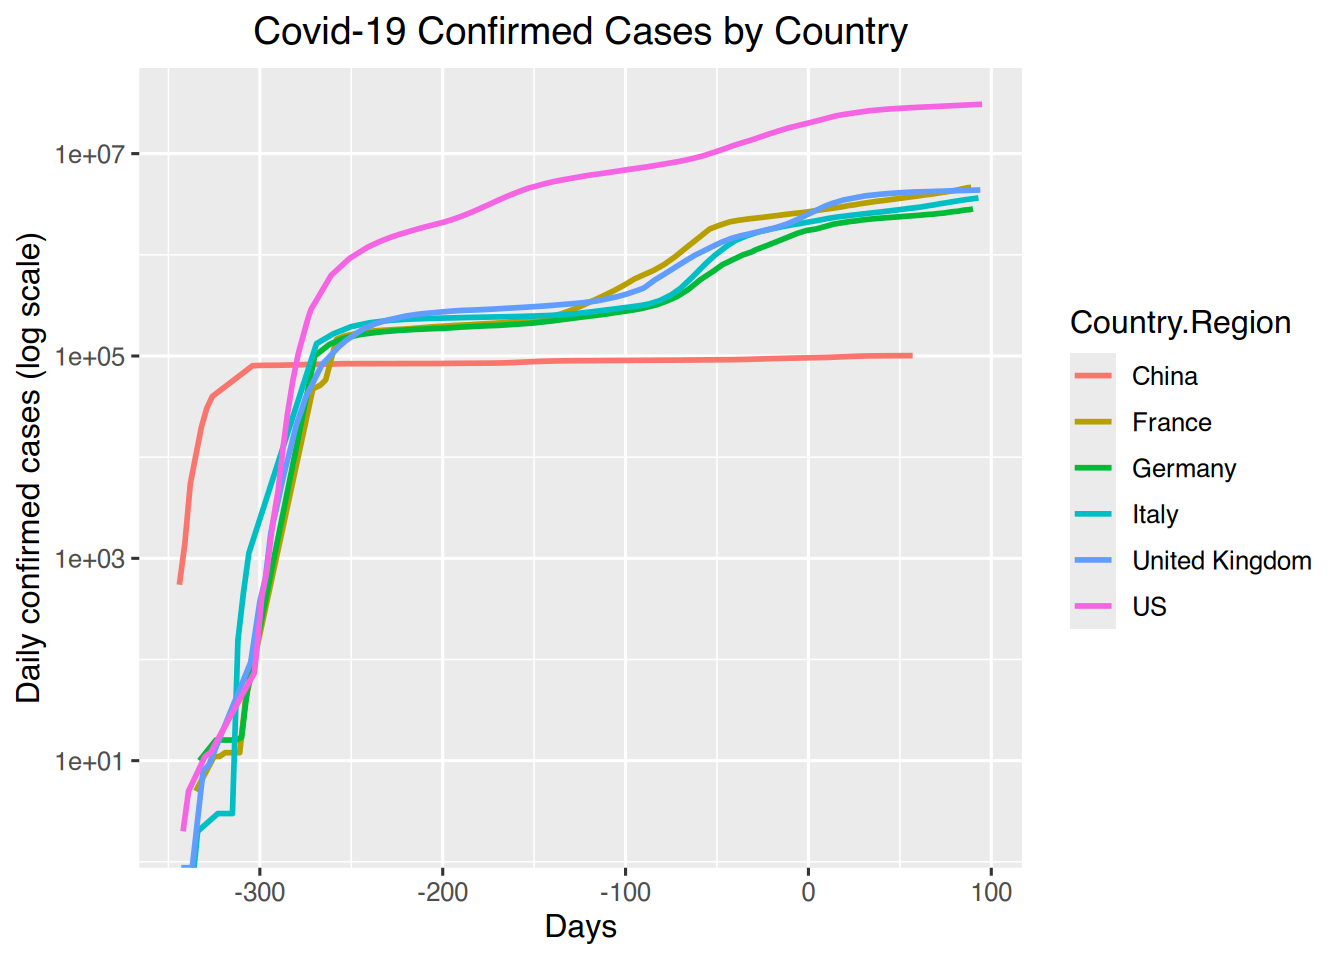
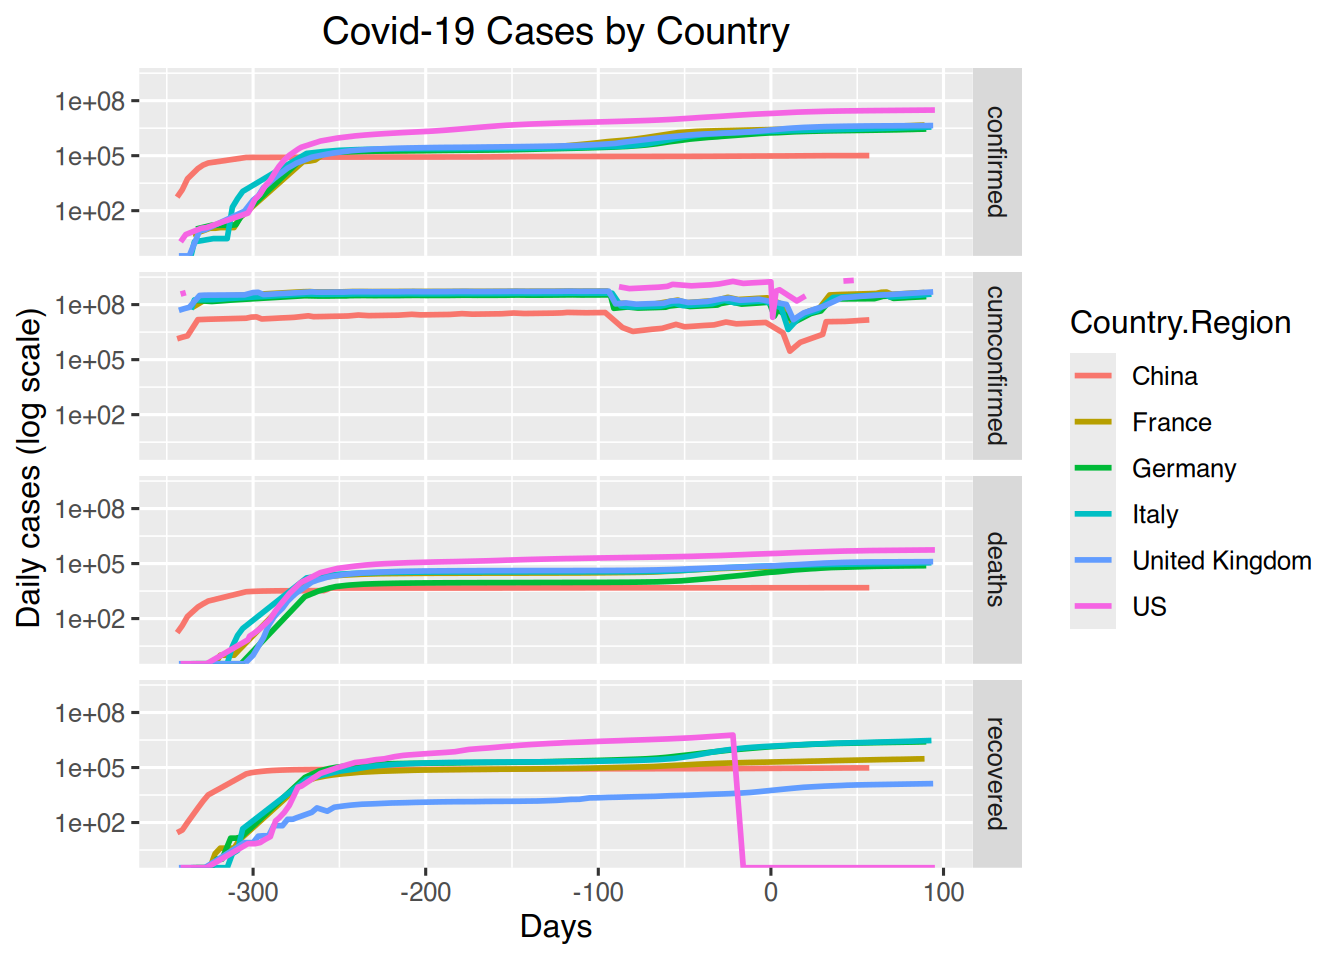
# Matrix of line graphs of confirmed, deaths and recovered for select countries in log10 scale
countryselection %>% gather("Type", "Cases", -c(date, days, Country.Region)) %>%
  ggplot(aes(x=days, y=Cases, colour=Country.Region)) + geom_line(size=1) +
  labs(title = "Covid-19 Cases by Country", x= "Days", y= "Daily cases (log scale)") +
  theme(plot.title = element_text(hjust = 0.5)) +
  scale_y_continuous(trans="log10") +
  facet_grid(rows=vars(Type))